Retention, transition and disaffiliation in American Christianity
How many Americans have retained their religious tradition, changed to another, or left altogether over time? This Tableau visualization aims to answer these questions with 50 years of data from the General Social Survey.

A Sankey diagram of Americans’ changing religious affiliations
How can we show change in quantity over time with cross-sectional data? In this Tableau visualization I used a Sankey diagram to depict patterns of change in Americans’ religious affiliation from childhood to adulthood.

Correlation is not causation — but it still matters
Should schools invest in an online test if students just click buttons — thus making “noise”? A practical explanation of reliability and validity for people who are not test experts
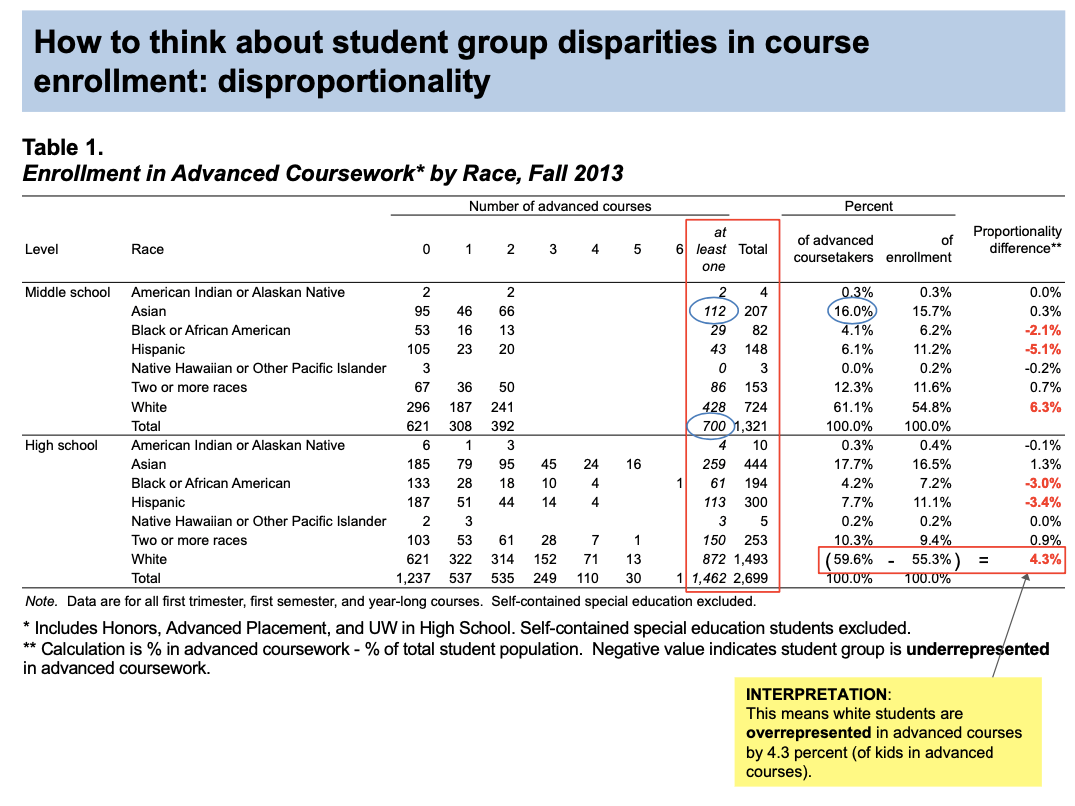
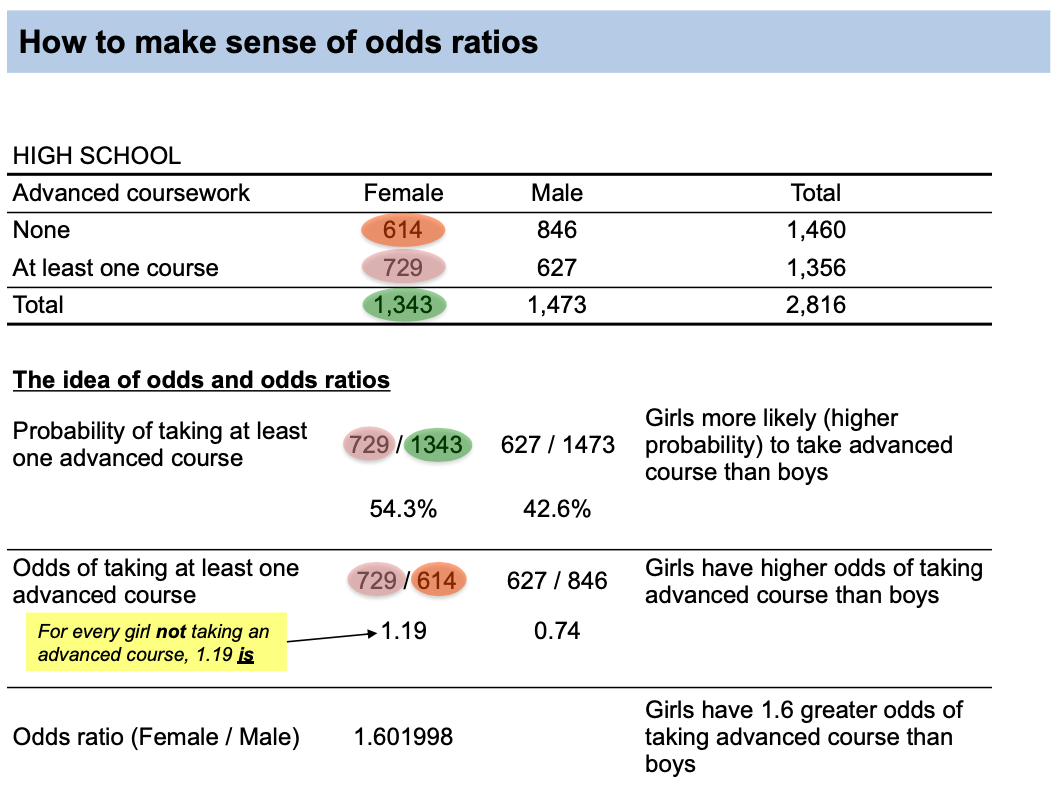
A practical use of logistic regression
Student enrollment in advanced courses was disproportional. Which student groups? Which courses? In this analysis of student course enrollment data I used logistic regression to answer these questions about disproportional enrollment.
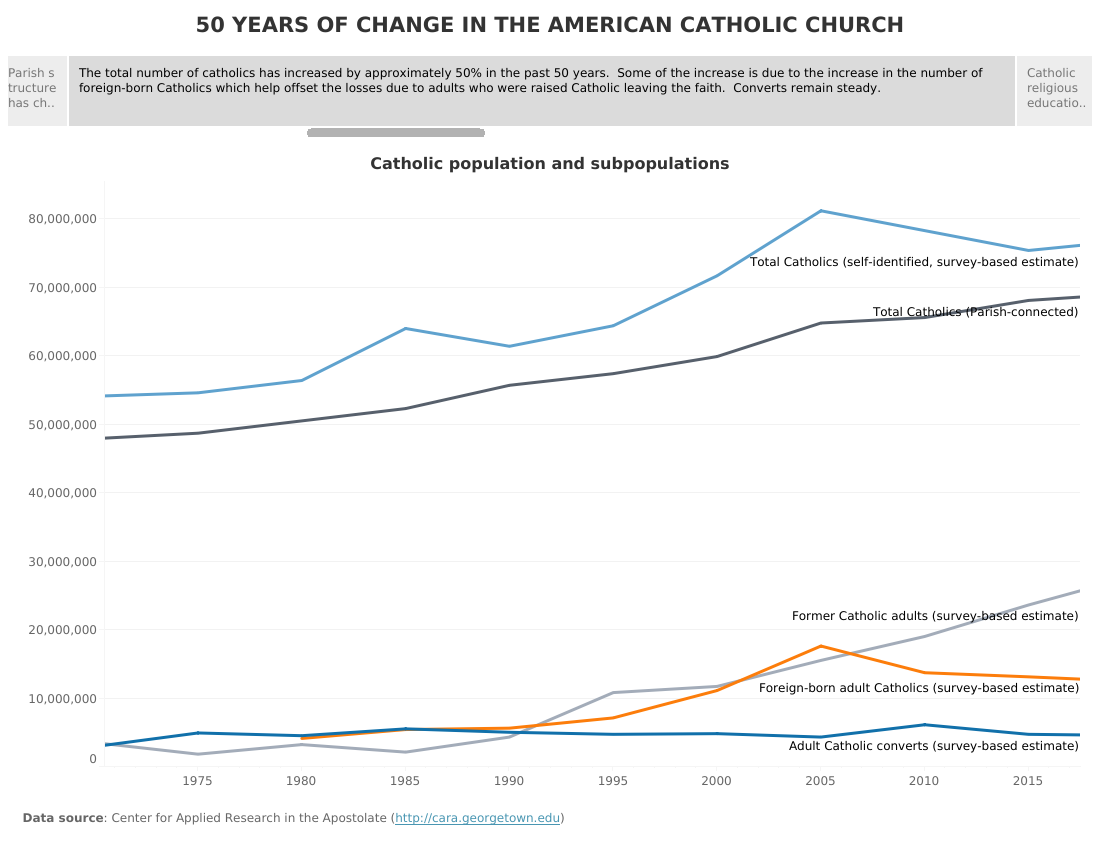
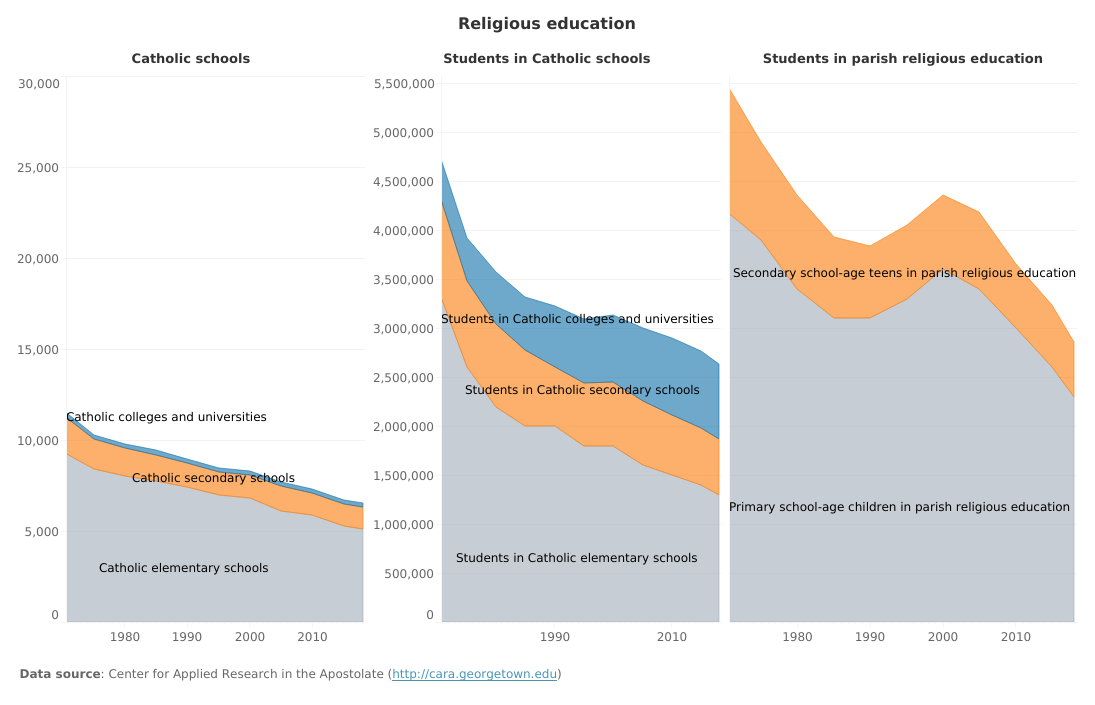
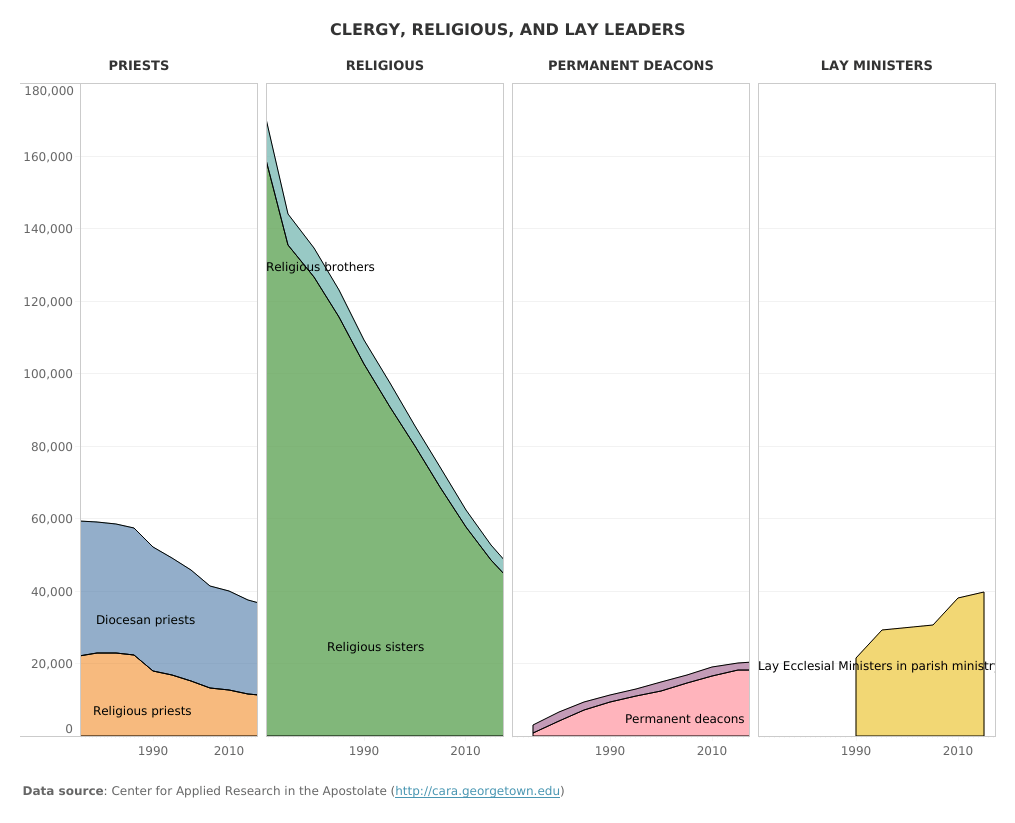
Change in the American Catholic Church
Vatican II was a watershed moment in the history of the Roman Catholic Church. This is a Tableau visualization of trends of change in the Catholic Church in the United States, based on public data from the Center for Applied Research in the Apostolate (CARA) at Georgetown University


How much learning is “lost” over the summer?
Educators speak freely of the “summer slide” in student learning. But many students learn a lot over the summer. In this longitudinal analysis of student achievement data I investigated change in achievement over the summer.
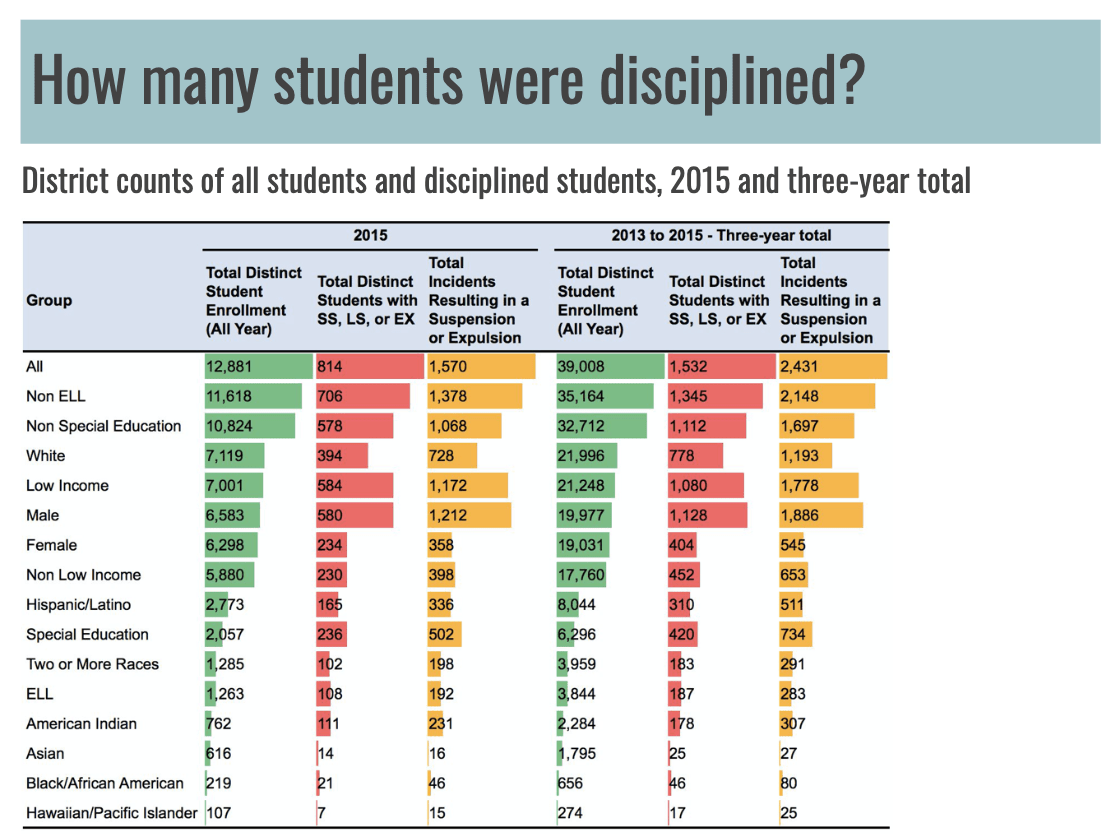
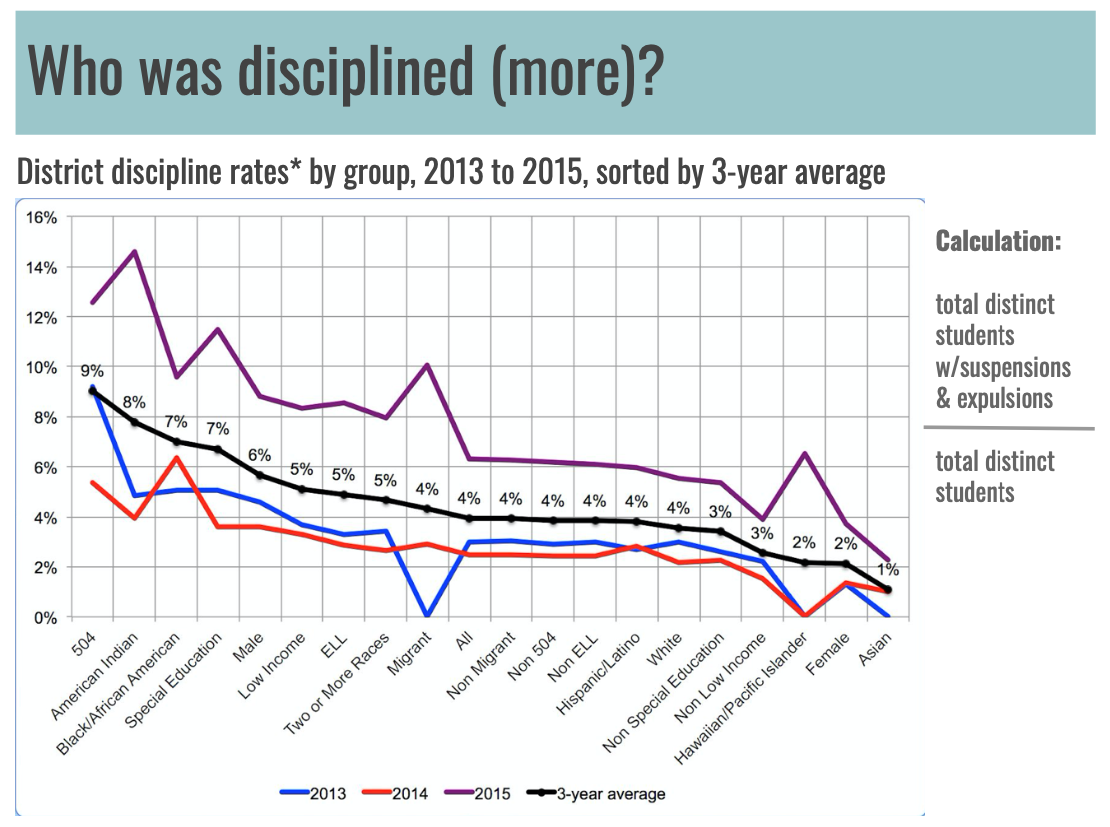
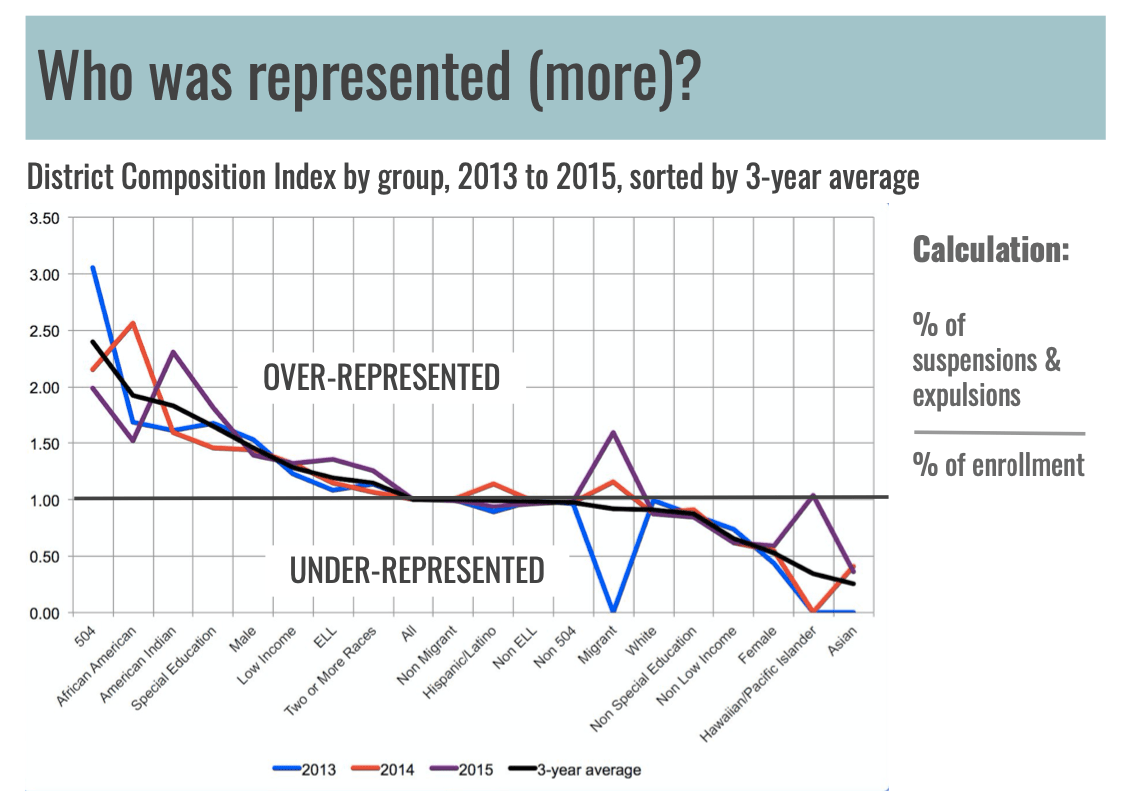
Visualizing disproportionality in discipline
Some student groups were more likely than others to be disciplined for the same offense. In this analysis and presentation of student discipline data I attempted to convey disproportional visually.


Effect size is a better way to look at student achievement
Schools accountable for their students’ learning needed evidence of growth. In this analysis of student achievement data I argued for effect size as a more valid metric of growth than percent meeting a proficiency standard.


Validity of elementary report card grades
Report card grades and end-of-year achievement tests both declare students proficient at grade level. Do they really measure the same thing? In this analysis of data from student report card grades and scores on the state proficiency test I investigated that question.
